Preface
One day we finally decide to install a virtualization cluster. Although we had just several Linux and 2 Windows servers, managing all that staff scattered across different boxes becomes too cumbersome and time consuming, so move and run them under KVM (kernel virtual machine) on 2 physical servers was a logical solution. Virtualization cluster would consist of only 2 nodes (HP ProLiant DL380) + 1 controller (host engine), managed by oVirt (great free open source virtualization manager developed by smart folks from Red Hat). CPU resources were not problem, my only concern was hard disk subsystem bottleneck, with many parallel IO threads from a dozen of virtual machines. Large capacity server grade SLC SSD were quite expensive in 2018, due to overall cost concerns I had to opt for conventional hard drives.
Benchmark tests were run on RAID L1 (2 x HP SAS 10000 rpm HDs), L5 (4 x WD Red NASware 5400 rpm) and L10 (same 4 x HD as L5), plus L10 via loopback NFS. Shared networked storage is a crucial component for the oVirt installation (here I’m explained why).
Hardware and Software Setup
- Server HP ProLiant DL380 G7, 2 x Quad-Core Xeon L5630 2.13GHz, 36 GB RAM
- HP SAS Smart Array P410i 512MB Cache (25% Read / 75% Write) <- remember this ratio!
- Hard drive set #1: HP SAS 146GB 10000rpm DG146ABAB4 2.5” – 2 pcs (formatted as L1 RAID)
- Hard drive set #2: WD Red SATA NASware 3 SATA 1TB 5400rpm WD10JFCX-68N 2.5” 16 MB Cache – 4 pcs (formatted as 3TB L5 or 2TB L10 RAID)
- Linux CentOS 7.4 with 4.x mainline kernel
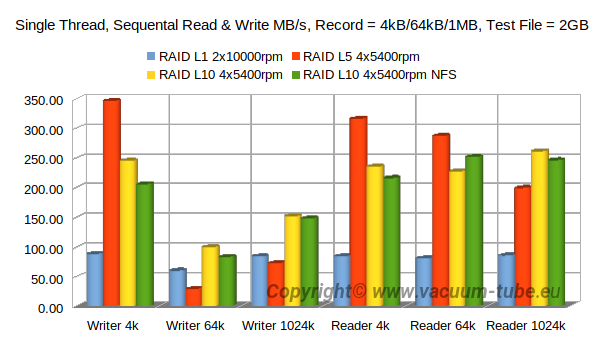
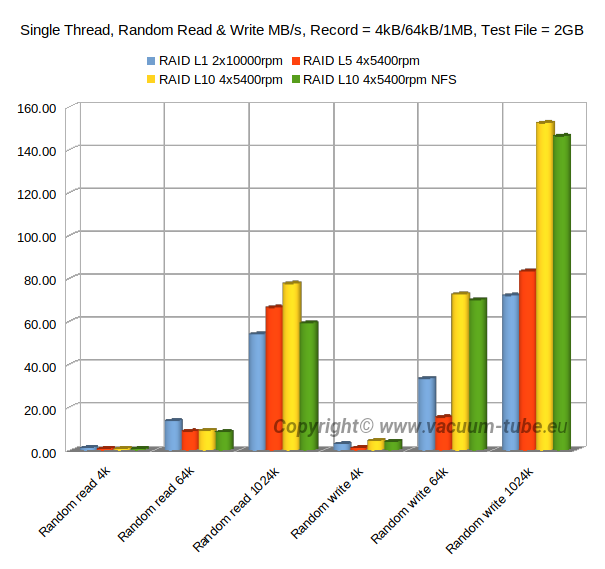
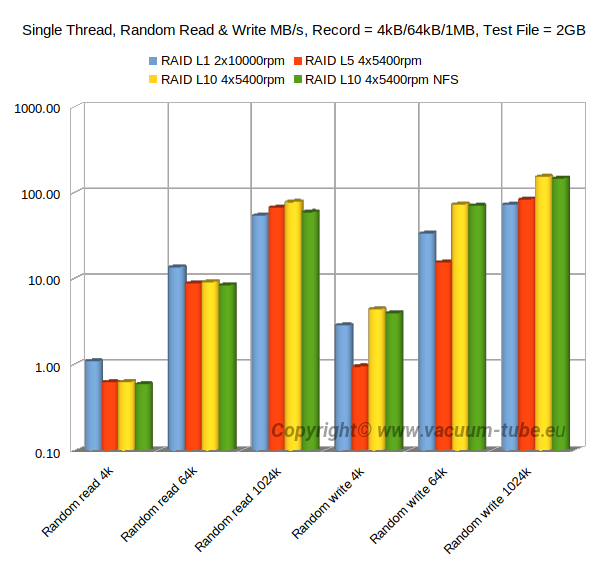
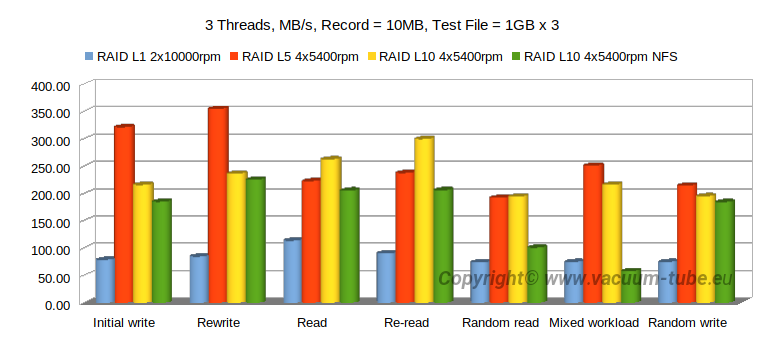
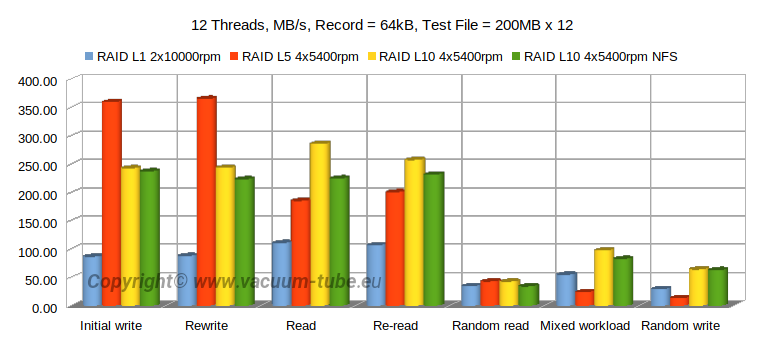
In order to compare directly HP SAS 10000rpm and WD NASware SATA 5400rpm one had to run tests on single drives or equal RAID level, e.g. L1. Unfortunately, I had very lomited time, so my only concern was final system performance. HP SAS drives were used only for OS (CentOS/oVirt node) installation. The objective was to select VM data storage between RAID L5 and L10, and measure negative impact of NFS loopback necessary which is necessary for oVirt shared storage domain. And going forward (plus correlating numbers), I can state that latter has lower (sometimes up to 30%) performance in random read/write (due to higher access time and lower RPM), the rest is comparable. Higher read/write figures of WD NASware RAID is a result of parallel data transfer to several drives simultaneously.
RAID L0 – data stripped across 2 or more (n) drives, read and write transfer rates up to (n) times as high as the individual drive. Not used on mission critical servers, failure of 1 drive means complete data loss. However, for video editing it may be a great asset.
RAID L1 – data mirrored across 2 drives, performance slightly slower then single drive.
RAID L5 – data stripped between drives with distributed parity, write performance is usually increased (compared to single drive or RAID L1) since all RAID members participate in the serving of write requests, yet final scores heavily depends upon particular controller. Parity calculation overhead may play its negative role.
RAID L10 – nested RAID, stripe of mirrors, theoretically highest performance level after RAID 0.
A Little of Theory – and This is Really Important
In short – small chunk random read is the worst operation in terms of overall speed.
OS Settings and Benchmark Software
I decided to perform 3 tests with IOzone. Command line options listed at the end of this page.
| When judging results, take into account 25% read / 75% write cache settings on RAID controller! |
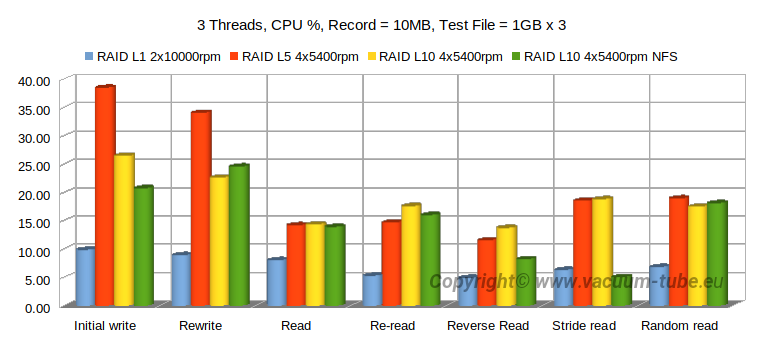
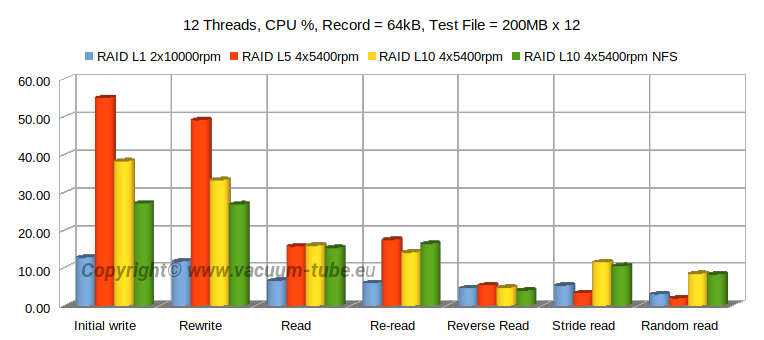
Final charts (with comments) are show below.
For throughput graphs, higher bars are better, for CPU load – opposite.
NFS Loopback
Impact of NFS loopback is very low, 10% or even less in average. Setup described above was used for a while with virtualization cluster running ISPConfig (on Debian), 2 accounting systems (1 on Linux, 1 on Windows), and several additional VMs for various needs (e.g. IP Telephony). I can rate performance as satisfactory for accounting systems, excellent for everything else.
YouTube Video
Short version (slide show) of this article available on YouTube (link).
Other oVirt-related videos:
oVirt – how to add 2nd (DMZ) network interface for virtual machines
oVirt – moving away from local storage setup to NFS/GlusterFS
IOZONE Command Line Options
iozone -+u -p -+T -r 4k -r 64k -r 1m -s 2g -i 0 -i 1 -i 2 -i 8 -f /vmraid/iozone.tmp -R -b ~/bench/test-1thr.xlsiozone -+u -p -t 3 -l 3 -u 3 -r 10m -s 1g -i 0 -i 1 -i 2 -i 8 -F /vmraid/F1 /vmraid/F2 /vmraid/F3 -R -b ~/bench/test-thr3.xlsiozone -O -+u -p -t 3 -l 3 -u 3 -r 10m -s 1g -i 0 -i 1 -i 2 -i 8 -F /vmraid/F1 /vmraid/F2 /vmraid/F3 -R -b ~/bench/test-thr3-io.xlsiozone -+u -p -t 12 -l 12 -u 12 -r 64k -s 200m -i 0 -i 1 -i 2 -i 8 -F /vmraid/F1 /vmraid/F2 /vmraid/F3 /vmraid/F4 /vmraid/F5 /vmraid/F6 /vmraid/F7 /vmraid/F8 /vmraid/F9 /vmraid/F10 /vmraid/F11 /vmraid/F12 -R -b ~/bench/test-thr12.xlsiozone -O -+u -p -t 12 -l 12 -u 12 -r 64k -s 200m -i 0 -i 1 -i 2 -i 8 -F /vmraid/F1 /vmraid/F2 /vmraid/F3 /vmraid/F4 /vmraid/F5 /vmraid/F6 /vmraid/F7 /vmraid/F8 /vmraid/F9 /vmraid/F10 /vmraid/F11 /vmraid/F12 -R -b ~/bench/test-thr12-io.xls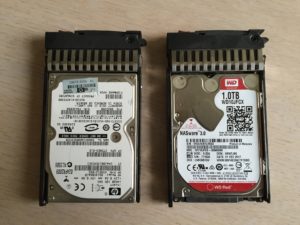
Leave a Reply
You must be logged in to post a comment.